Nexudus Explore Basic comes with predefined dashboards including useful metrics and charts about the different modules available in the Nexudus Platform.
When using Explore Basic, you cannot edit or add new dashboards but you can change the date range they show data for and load them into the designer.
With Explore Basic, you can use the designer to change existing dashboards or create your own reports or dashboards, but you won't be able to save those changes.
Bookings Dashboard
This dashboard shows essential metrics about your booking calendar.
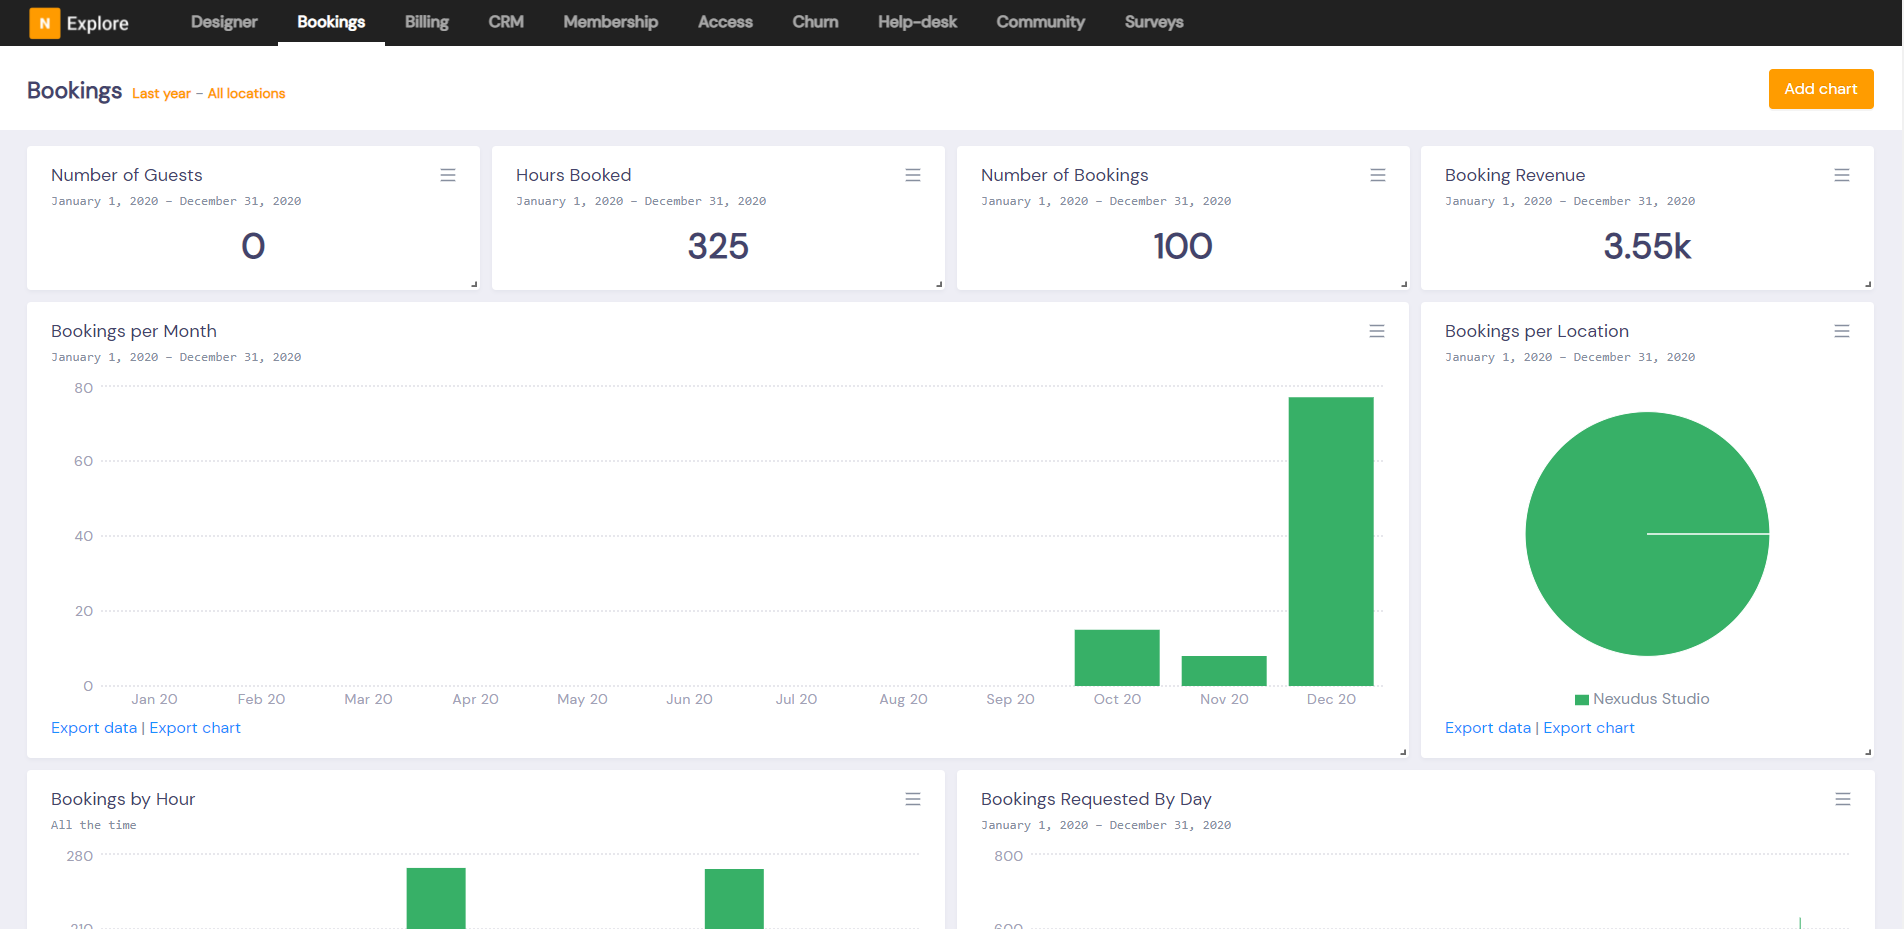
| Widget | Description |
| Number of Bookings | The number of bookings recorded in the selected period. |
| Hours Booked | The number of hours booked in the selected period. |
| Number of Guests | The number of guests added to bookings placed in the selected period. |
| Bookings Revenue | The total amount charged for bookings in the selected period. |
| Bookings per Month | The amount of time booked every month. |
| Bookings per Location | The amount of time booked in each of your locations. |
| Bookings by hour | The number of bookings placed in each hour of the day. |
| Bookings Requested by Day | The amount of time booked by day of the week. |
| Most booked resources | The list of resources ordered from the most booked to the least. |
| Top Booking Customers | The list of customers who booked ordered from the most frequent booker to the one who booked the least number of times over the selected period. |
Billing Dashboard
This dashboard shows information and metrics about your financial activity such as invoicing and payments.
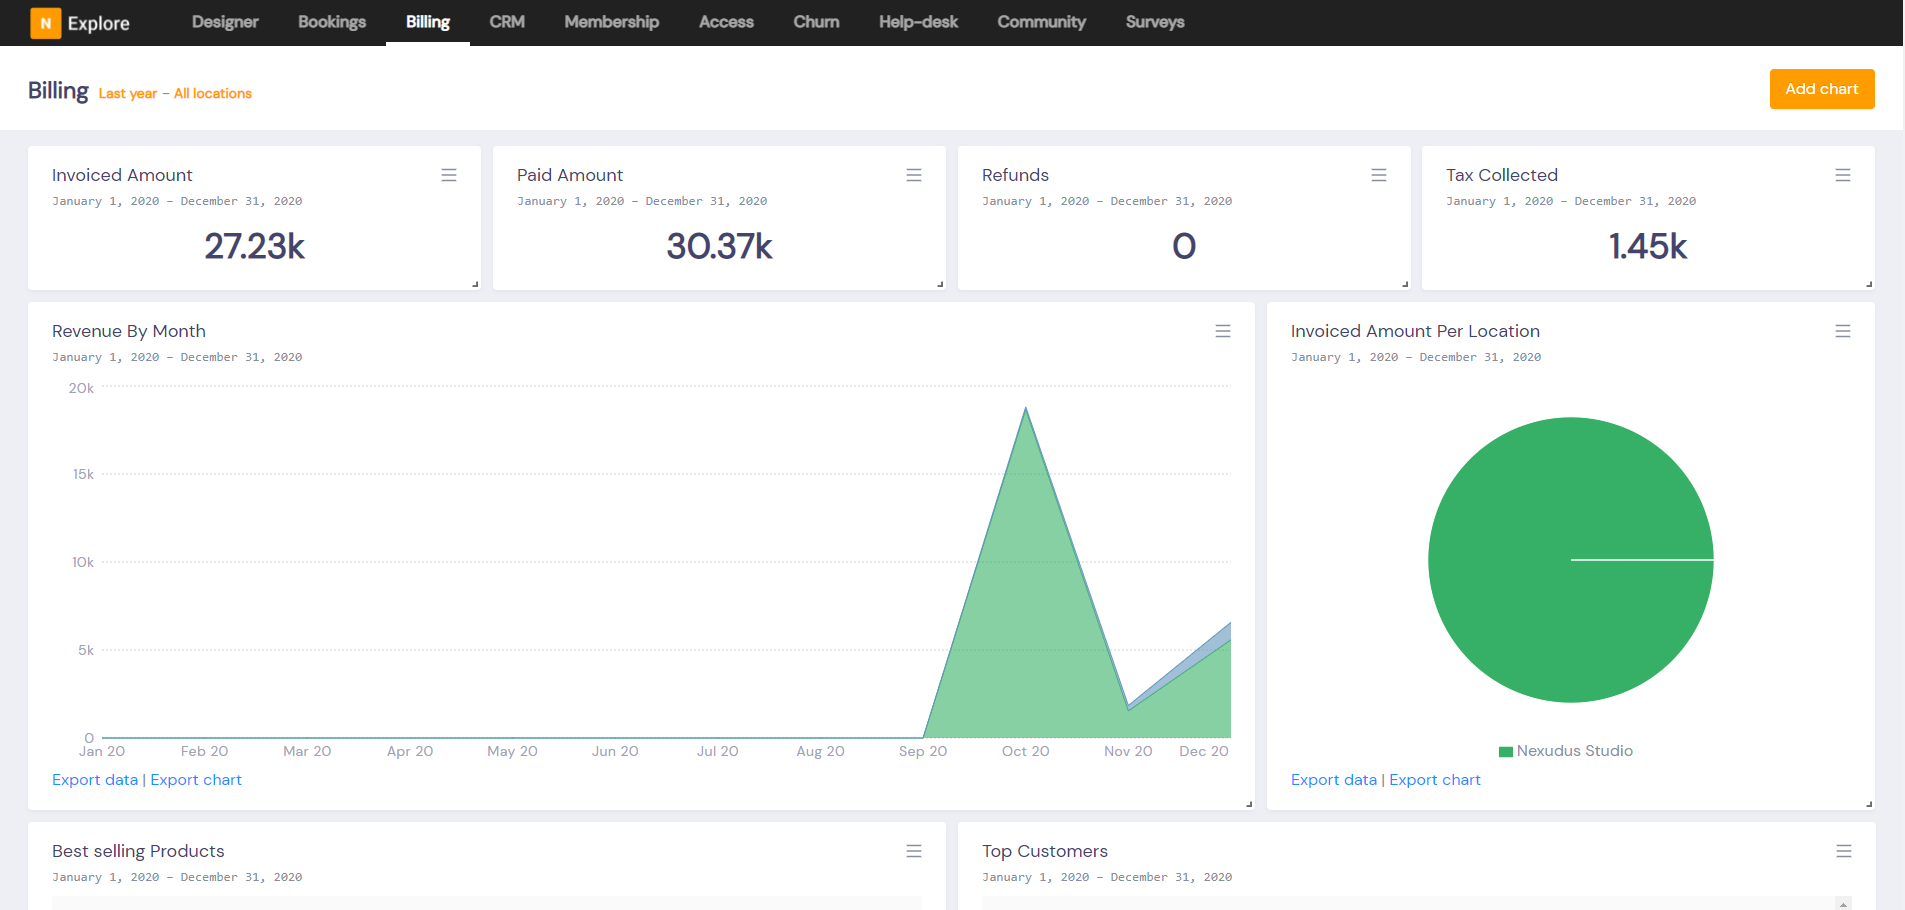
| Widget | Description |
| Invoiced Amount | The total amount invoiced during the selected period. |
| Paid Amount | The total amount received in payments during the selected period. |
| Refunds | The total amount processed in refunds during the selected period. |
| Tax Collected | The total amount of tax collected during the selected period. |
| Revenue by Month | The amount invoiced during the selected period as sub-total (exc. tax) and tax. |
| Invoiced Amount per Site | The amount invoiced by each of your locations. |
| Best selling products | The list of invoiced products sorted from the most sold to the least. |
| Top Customers | The list of invoiced customers sorted from the one with the most invoiced amount to the least. |
CRM
This dashboard shows information about opportunities in your CRM boards, their status and potential value.
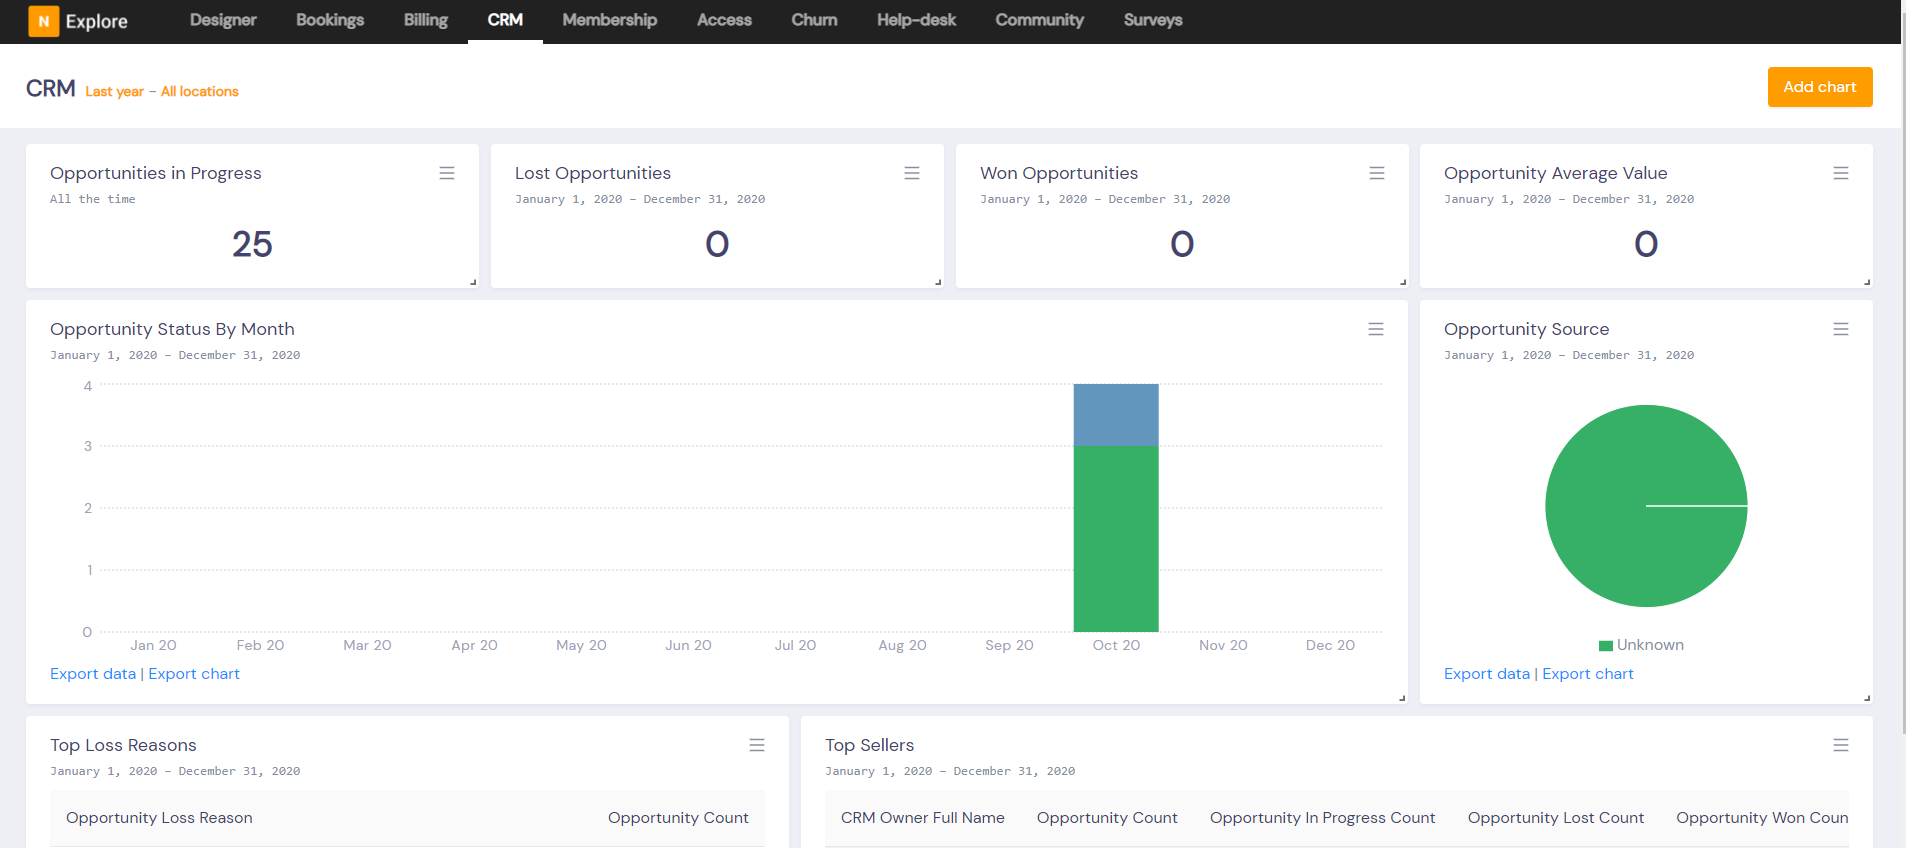
| Widget | Description |
| Opportunities in Progress | The total number of opportunities currently in progress. |
| Lost Opportunities | The number of opportunities lost in the selected period. |
| Won Opportunities | The number of opportunities won in the selected period. |
| Opportunity Average Value | The average value of the opportunities created in the selected period. |
| Opportunity Status By Month | The number of opportunities in each status by month in the selected period. |
| Opportunity Source | The total number of opportunities by their source. |
| Top Loss Reasons | The list of loss reasons attributed to opportunities ordered by the most common to the least. |
| Top Sellers | The list of CRM agents with opportunities assigned to them ordered by the one winning the most opportunities to the one winning the least. |
Membership
This dashboard shows information about the current number of members, contracts and their value.
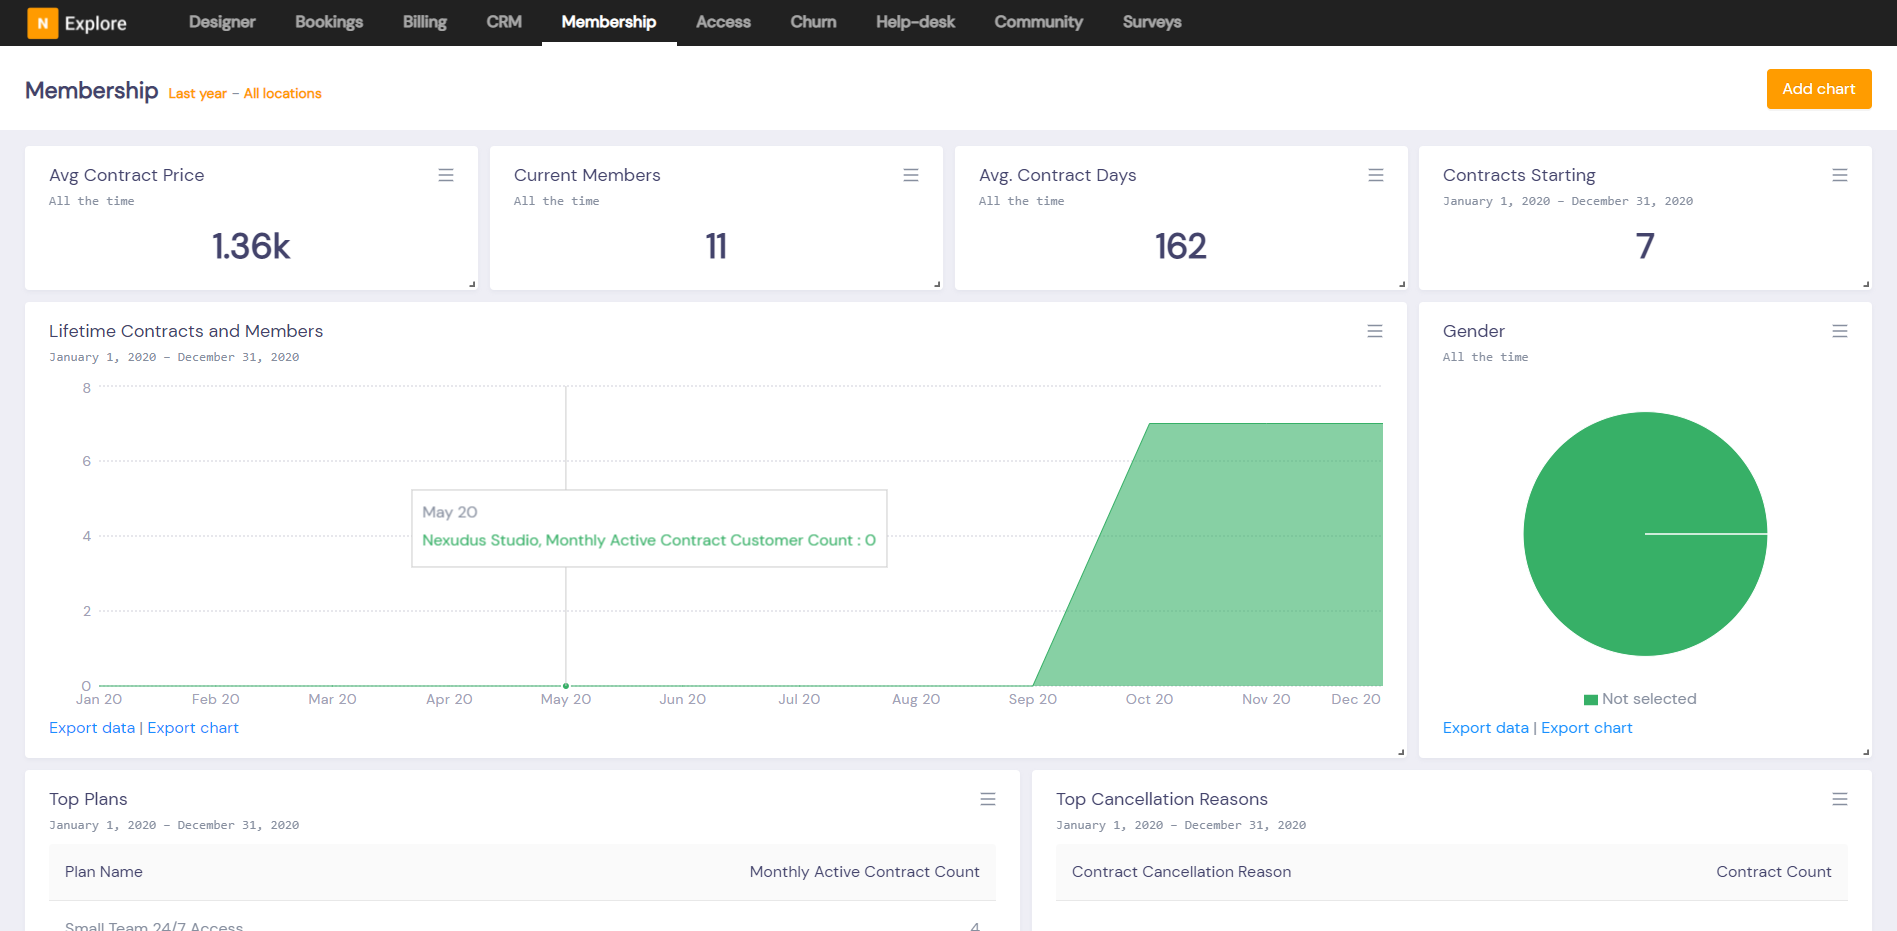
| Widget | Description |
| Current Members | The current number of customers with an active contract. |
| Avg Contract Days | The average length of all contracts in days. |
| Avg Contract Price | The average price of all contracts. |
| Gender | The number of customers of each gender. |
| Lifetime Contracts and Members | The number of customers and contracts by month during the selected period. |
| Contracts Starting | The number of contracts with a start date in the selected period. |
| Top Plans | The list of plans ordered from the one with the most number of active contracts to the one with the least. |
| Top Cancellations Reason | The list of cancellation reasons assigned to contracts ordered from the one assigned to most contracts to the one assigned to the least. |
Access
This dashboard shows information and metrics about who was in each of your locations and for how long.
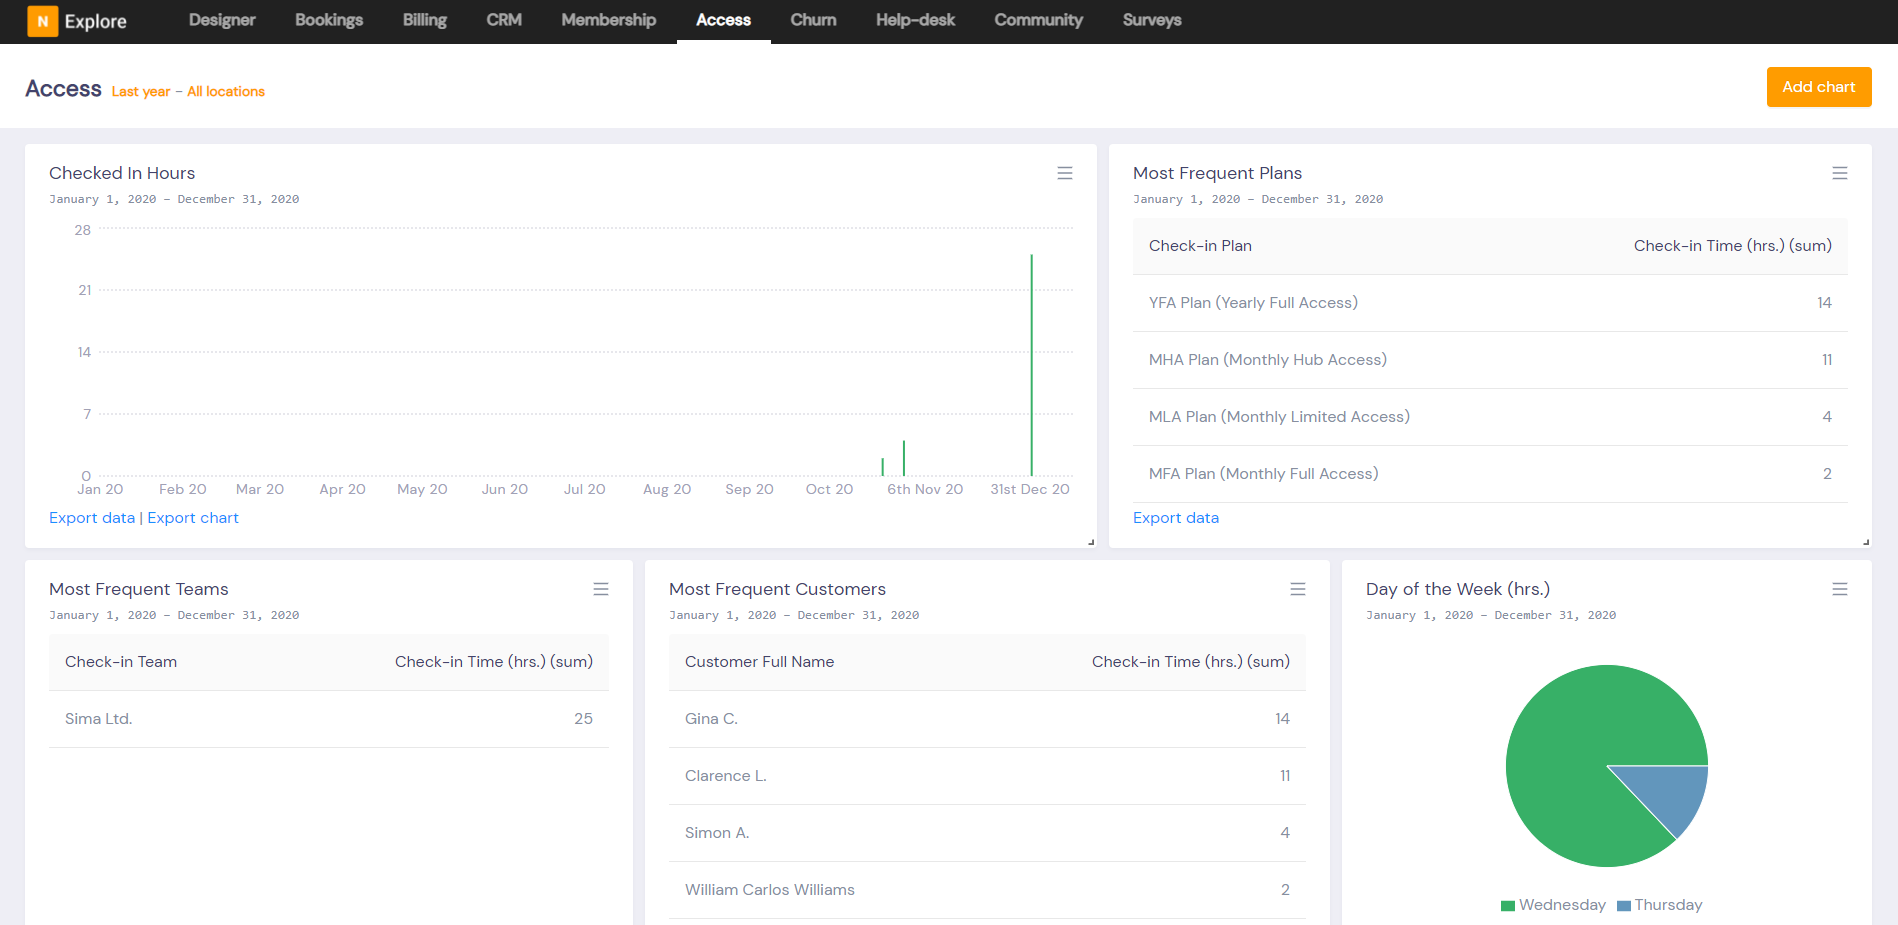
| Widget | Description |
| Checked In Time a day | The number of hours customers checked in a day for each of your locations during the selected period. |
| Most Frequent Plans | The list of plans sorted from the one with the most customers coming to your locations to the one with the least. |
| Most Frequent Teams | The list of teams sorted from the one with the most customers coming to your locations to the one with the least. |
| Most Frequent Customers | The list of customers sorted from the one with the most time coming to your locations to the one with the least. |
| Busiest Day of the Week | The number of hours spent by customers in your locations divided by the day of the week they did so. |
Help-Desk
This dashboard shows information and metrics about your help-desk tickets.
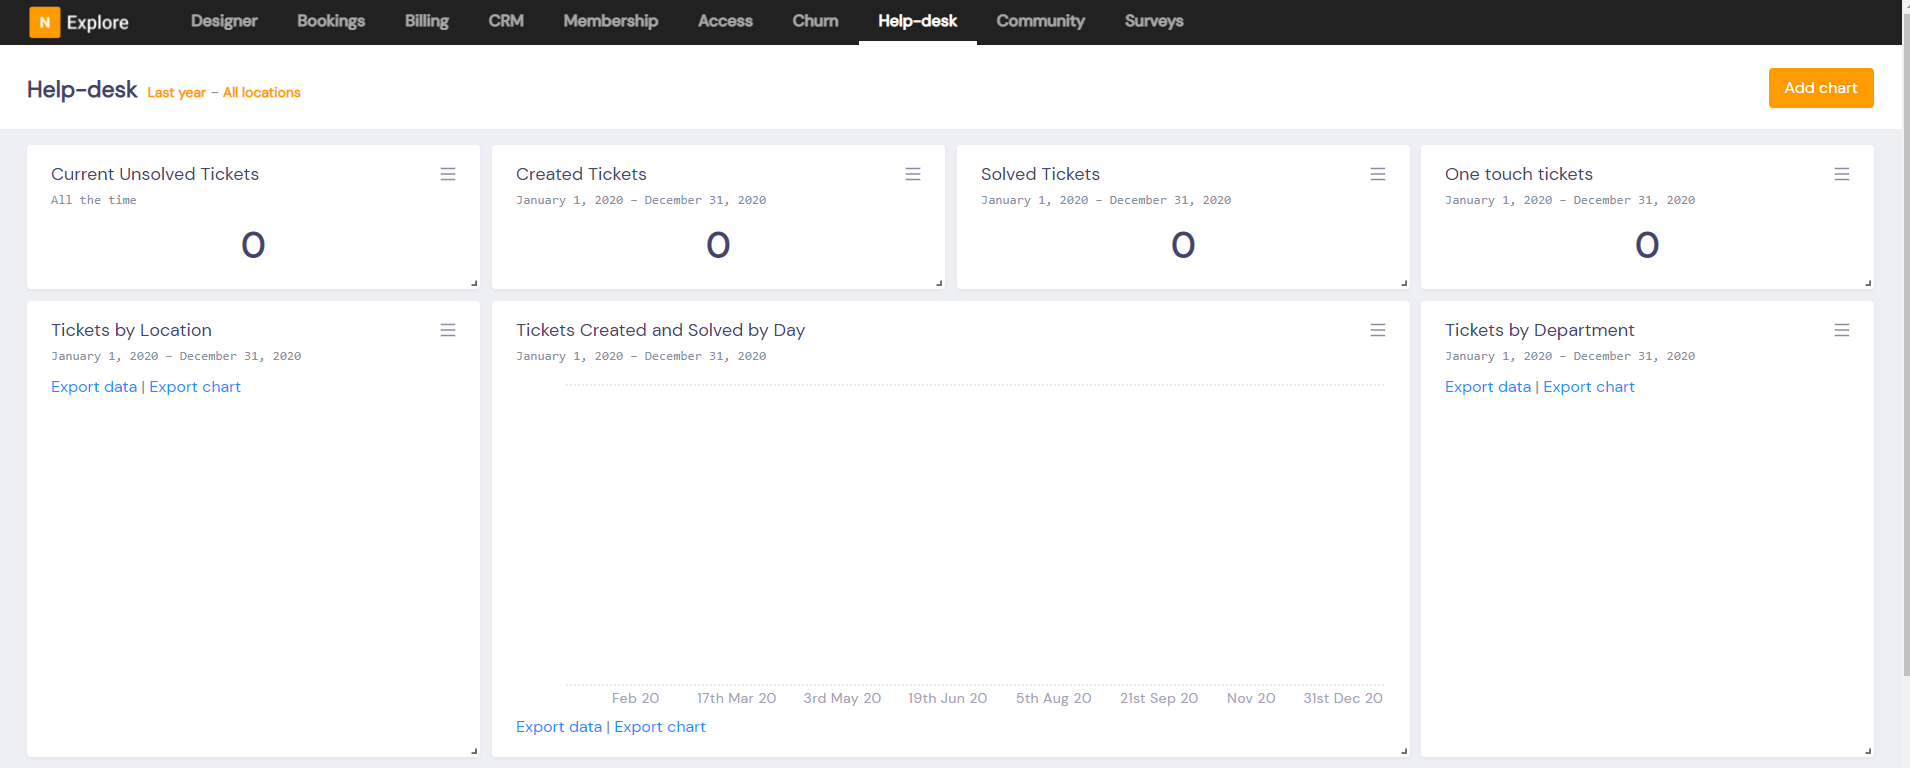
| Widget | Description |
| Current Unsolved Tickets | The total number of unsolved tickets |
| Created Tickets | The number of created tickets during the selected period. |
| Solved Tickets | The number of solved tickets during the selected period. |
| One-touch tickets | The number of tickets solved with a single interaction with the customer solved during the selected period. |
| Tickets by Location | The number of tickets created in each of your locations. |
| Tickets Created and Solved by Day | The number of tickets created by day during the selected period and the number of those tickets which are solved. |
| Tickets by Department | The number of tickets created in each department during the selected period. |
| Avg Hours to Close | The average number of hours to close tickets in the selected period. |
| Tickets by Day Of Week | The number of tickets created each day of the week during the selected period. |