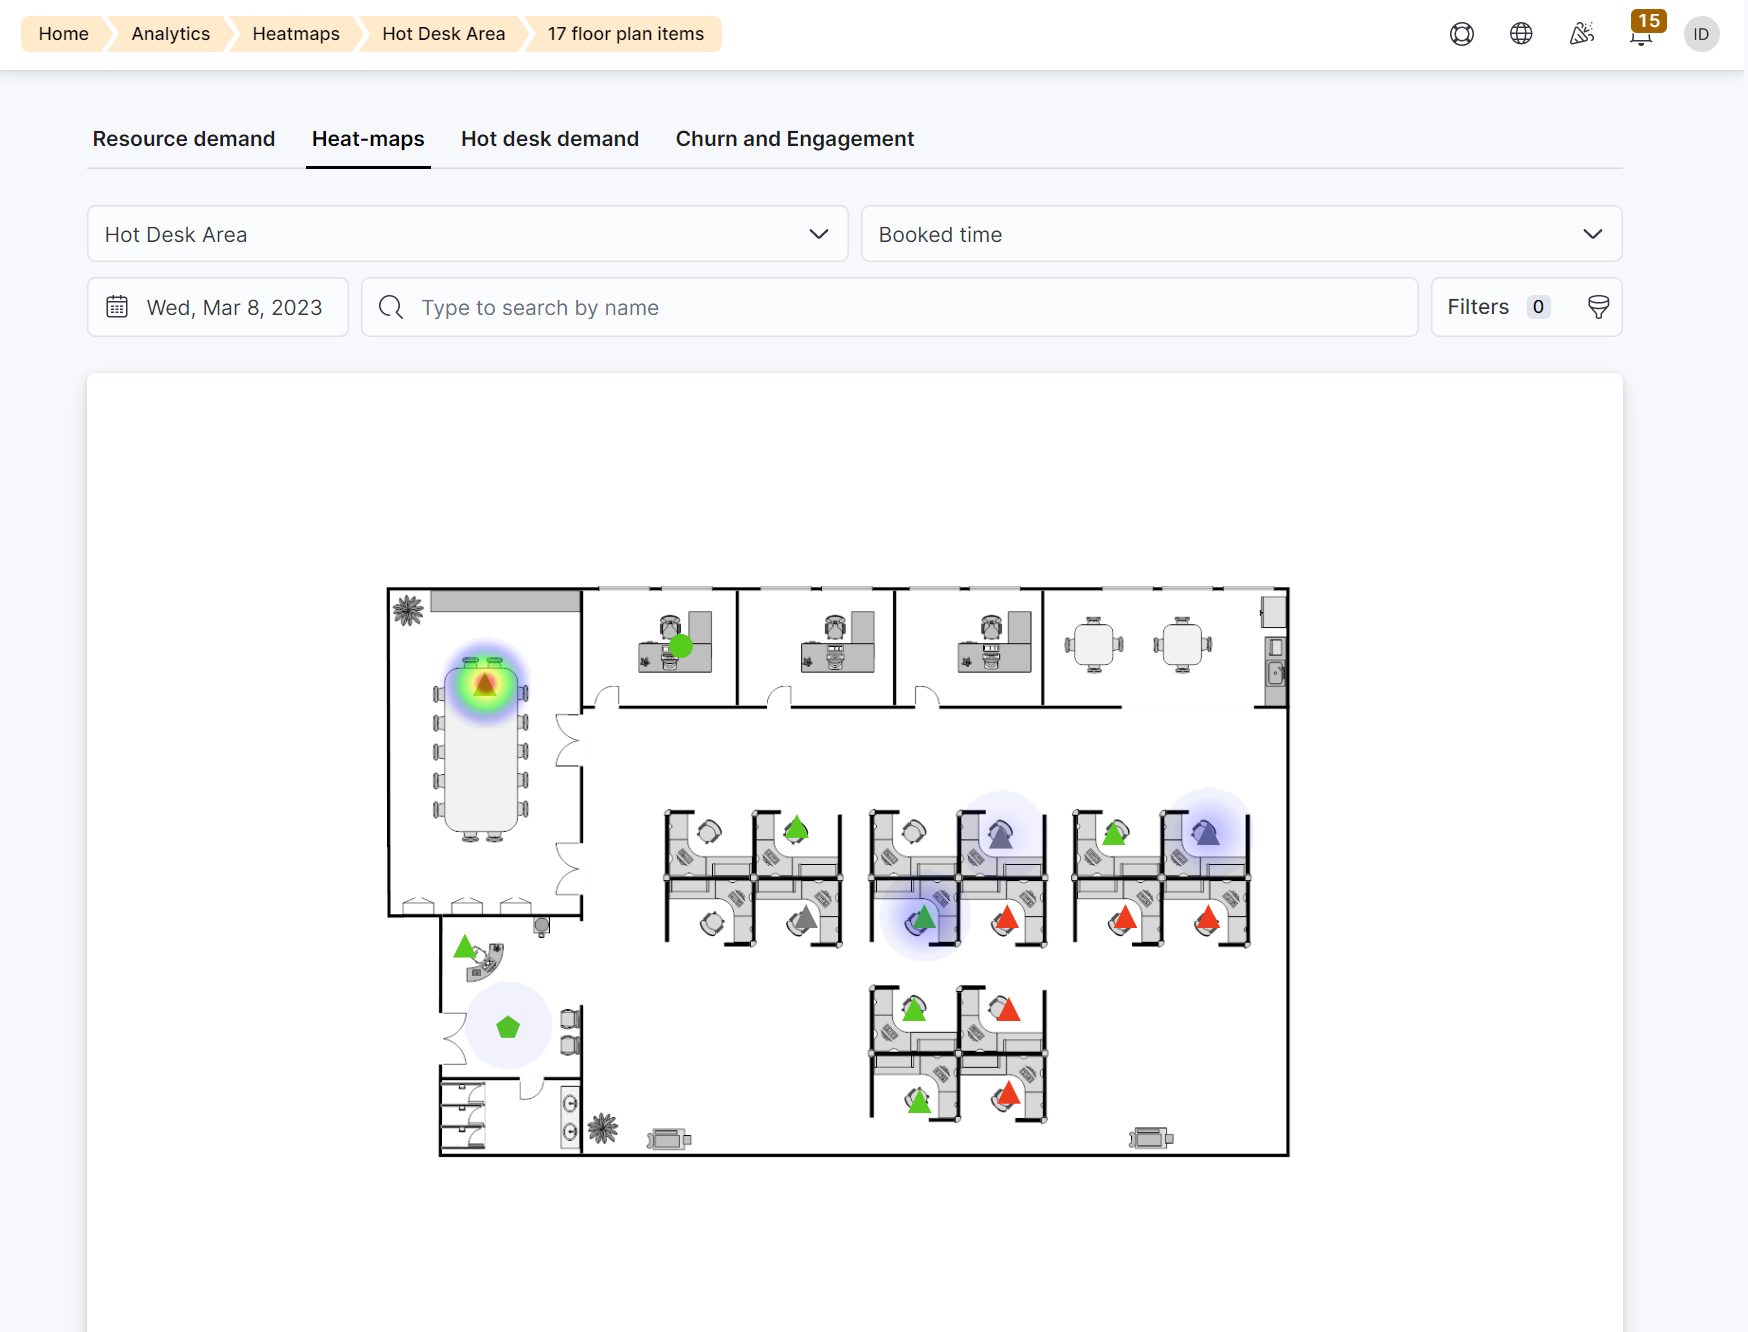
What are Heatmaps ?
Heatmaps are a visual representation of the floor plan areas that your customers book the most. It also lets you know which resources generate the most revenue.

Quickly spot which floor plan items or areas are the most popular among customers on any given day. Heatmaps are based on floor plan occupancy and revenue. Each of your floor plans has its own heat map that lets you easily spot which areas of your space attract more customers and generate the most revenue.
How Heatmaps Work
In order to use heat maps you need:
-
Floor plans
You need at least one floor plan with floor plan items. If you haven't uploaded and set up a floor plan yet, check out our guide on Adding Floor Plans. -
Resources connected to your floor plan items
Heatmaps rely on bookings recorded for each floor plan item. Floor plans with items that aren't connected to any resource remain blank. If you haven't connected your floor plan items to resources yet, check out our guide on Connecting Floor Plan Items to Resources.
Once you have floor plans and resources connected to their items, the Heatmaps tab automatically shows you which floor plan items are booked most frequently using colors ranging from purple to red. The closer to light purple, the least number of bookings recorded for items in that area. The closer to red, the higher the number of bookings recorded for an area or a specific floor plan item. Areas without any color don't have any bookings recorded for the selected day.
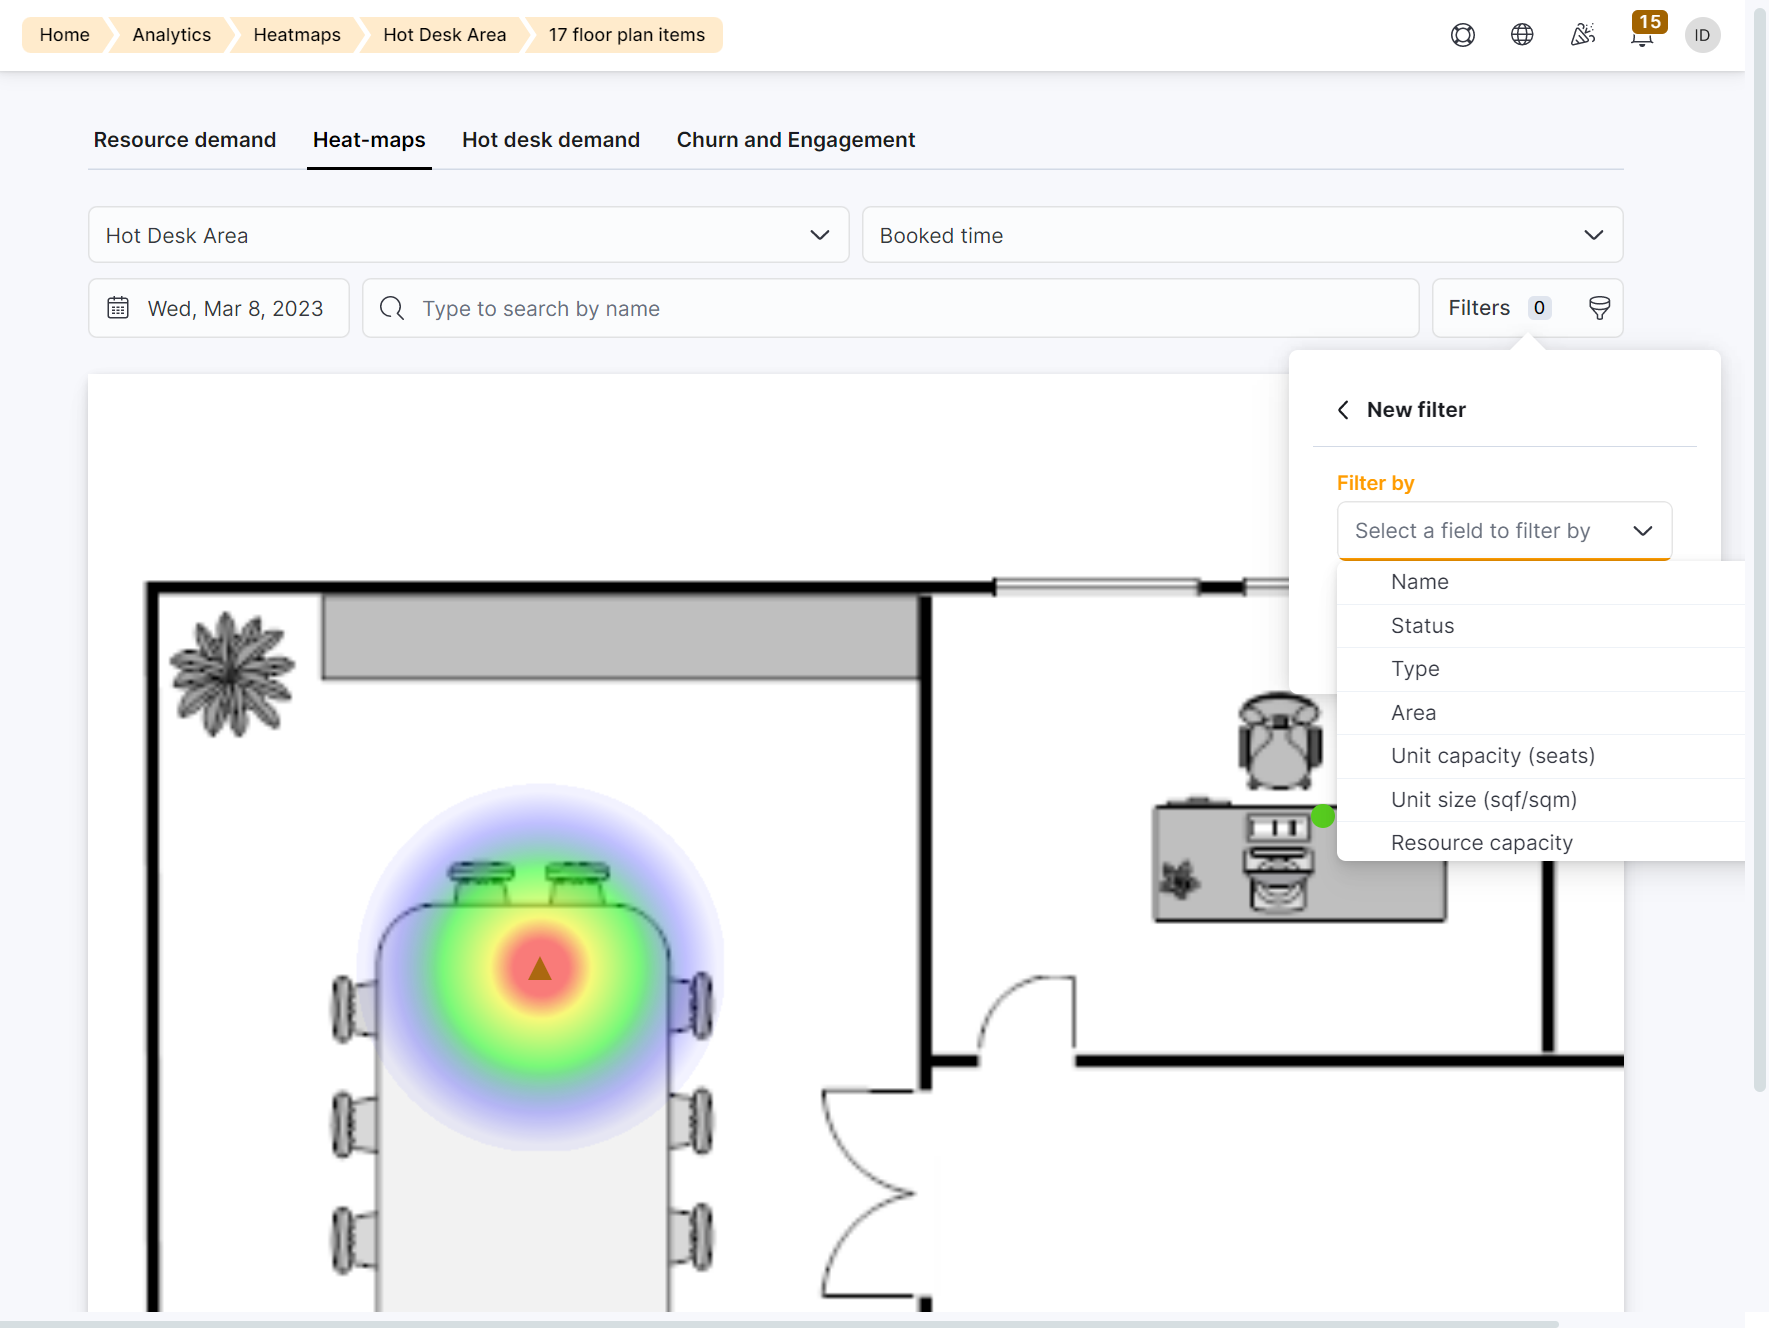
You can filter your heat maps by Booked Time or Generated Revenue. These two options let you see heat maps based on the overall booking time of your floor plan items or the total revenue generated by each of them.
You can also filter your floor plans by resource features, name, area, and more.

For example, you want to see a revenue heatmap of resources that can accommodate between 10 and 15 customers only.