Bookings - Avg. Revenue Per Hour
This report includes the average hourly revenue of each resource month by month.
Bookings - By Time of Day
This report includes:
- The total number of bookings per day for each resource
- The total revenue generated per day for each resource
- The number of bookings per hour of the day for each resource
- The average revenue generated per hour for each resource
Bookings - By Weekday
This report includes:
- The total number of bookings per weekday for each resource
- A pie chart comparing the popularity of the different week days

Bookings - Resource Usage
This report includes:
- The total number of bookings per resource
- The total number of hours of booking time per resource
- The total revenue generated by each resource
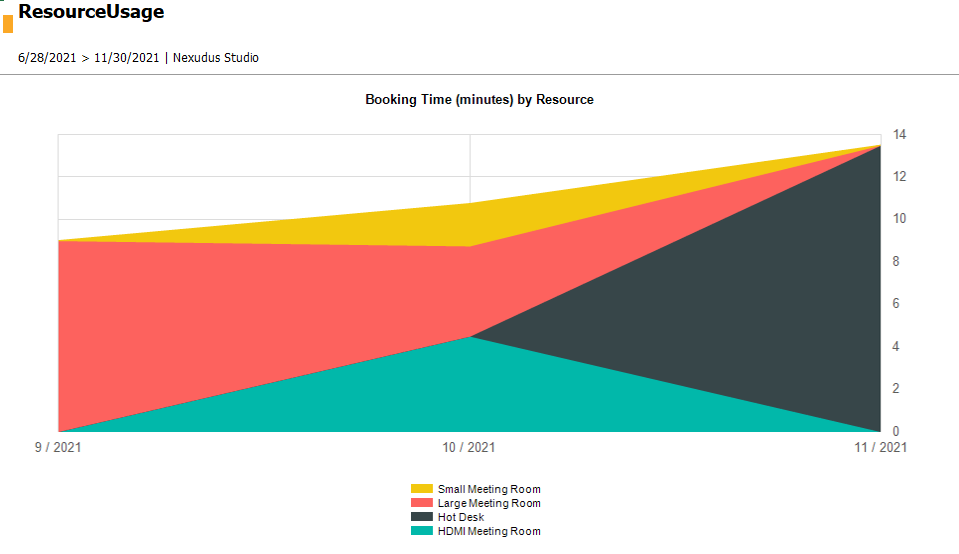
- A chart comparing the total booking time of each resource

Bookings - Resource Usage and Rev.
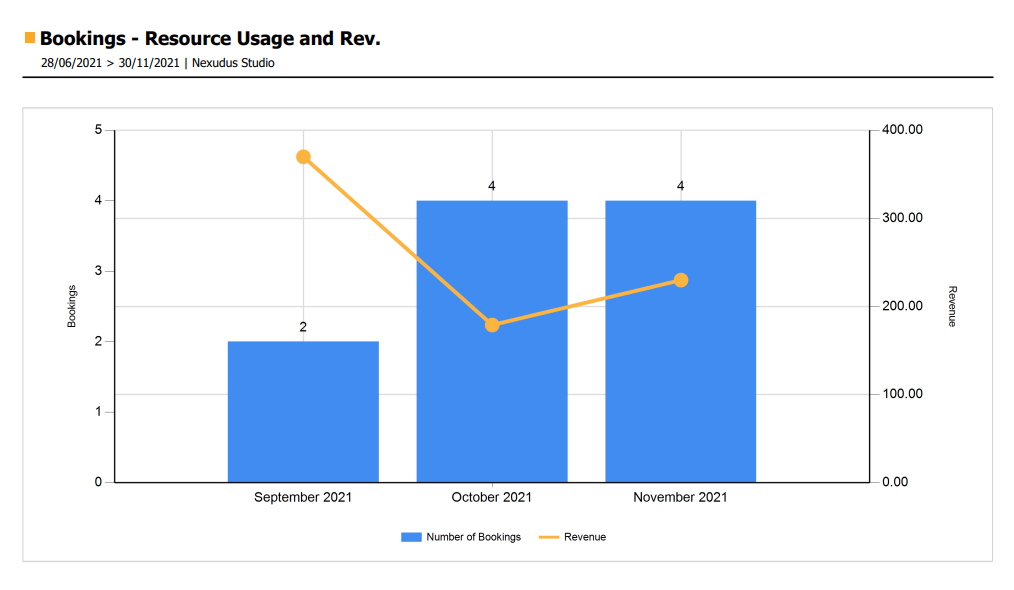
This report includes a bar chart that includes the number of bookings and the revenue generated every month for all your resources.

Bookings - User Type
:
- The number and % of bookings made by members and contacts per month and resource
- The number and % of bookings made via the Members Portal and the Admin Panel per month and resource
- The total revenue generated by all customer bookings per month and resource
Bookings - Weekdays
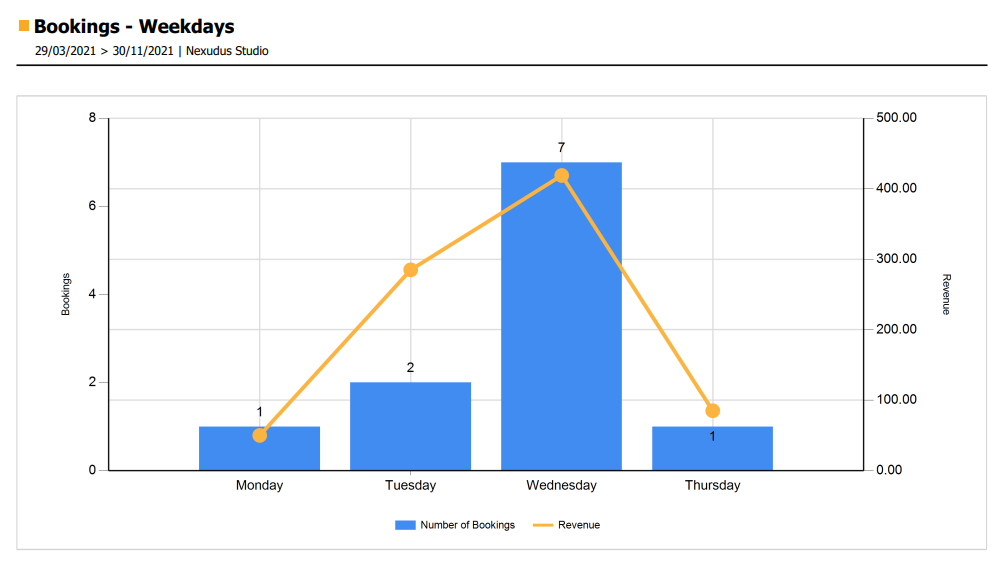
This report includes a bar chart with the total number of bookings for all resources and the revenue generated on each week day over the selected time period.

Bookings - Weekdays & Resource
This report includes a bar chart with the total number of bookings for each resource per day of the week.

Churn Rate - Chart
This report includes a graph of the churn rate over the selected time period.

Churn Rate - Monthly
This report includes:
- The total number of contract signups per month
- The total number of contract renewals per month
- The total number of contract cancellations per month
Churn Rate - Quarterly
This report includes:
- The total number of contract signups per quarter
- The total number of contract renewals per quarter
- The total number of contact cancellations per quarter
Contracts Revenue
This report includes:
- The revenue generated by contracts linked to floor plan units per month
- The details of the floor plan unit's name, area, capacity, size
- The name of the customer linked to the contract
Revenue - By Month
This report includes the quantity of items sold and total revenue generated by each inventory item you sold each month within the selected time frame.
Revenue - By Space
This report includes the total revenue generated every month by each of your locations within the selected time frame.
Revenue - Monthly By Account
This report includes:
- The total revenue generated for each financial account per month
- The total number of item sold for each financial account per month
- The total revenue generated by each customer per month
- The total number of items sold to each customer per month